Google Ads KPIs – Picture a pilot flying a plane without looking at the instruments. No speed gauge. No altitude meter. No fuel indicator. Terrifying, right? Running Google Ads without tracking the right numbers is a lot like that. You might be moving, but you have no idea if you are heading in the right direction — or about to run out of fuel.
That is exactly what Google Ads KPIs are for. KPI stands for Key Performance Indicator — a fancy way of saying “the numbers that actually tell you how your ads are doing.” In 2026, Google Ads has more data available than ever before, which is great — but it also means it is easier than ever to focus on the wrong numbers and miss what really matters.
This guide will walk you through the most important Google Ads KPIs, what good numbers look like right now, what has recently changed, and how to use all of this to make smarter decisions for your business. No confusing jargon. Just clear, useful information.
Why Tracking the Right Google Ads KPIs Matters
Not all numbers in Google Ads are created equal. Some numbers look impressive but do not actually tell you if your business is growing. Others are small but incredibly powerful for diagnosing problems and finding opportunities.
Here is the key insight: Google will not tell you if your numbers are good or bad. It just shows you the data. The only way to know whether your click-through rate is strong or your cost per click is too high is to compare your numbers against real industry benchmarks. That context is what turns raw data into smart decisions.
Tracking the right Google Ads KPIs helps you understand where your budget is going, what is working, what needs fixing, and how to grow your results over time. It is also the foundation of strong Google Ads performance — because you cannot improve what you do not measure.
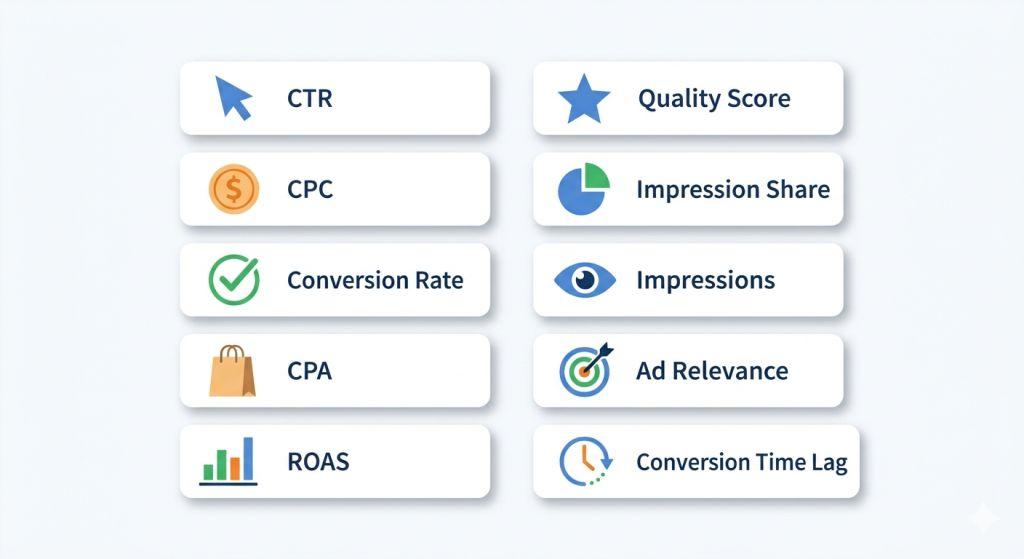
The 10 Most Important Google Ads KPIs in 2026
Let’s break down the key metrics every business owner should know — in plain, simple language.
1. Click-Through Rate (CTR)
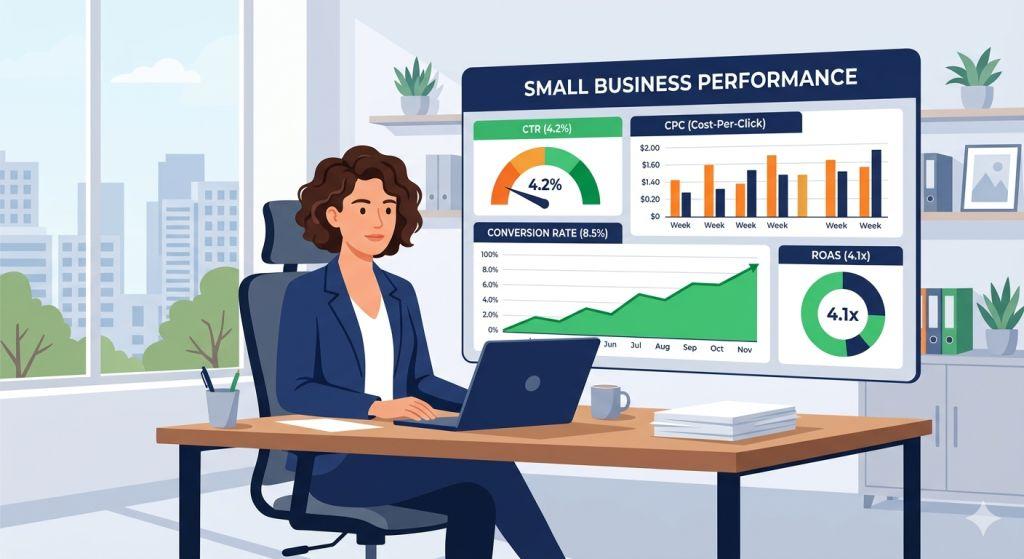
CTR tells you what percentage of people who saw your ad actually clicked on it. The formula is simple: clicks divided by impressions, multiplied by 100. The average CTR for Google Search Ads in 2026 is 6.64% across all industries. If your CTR is well below that, your ad copy might not be connecting with the right audience — or your targeting might need adjustment. Think of CTR like a storefront window display: the more eye-catching it is, the more people walk in.
2. Cost Per Click (CPC)
CPC is how much you pay every time someone clicks your ad. In 2026, the average CPC for Search Ads ranges from $1.50 to $4.20 depending on your industry. Legal services can cost as much as $8 to $15 per click, while eCommerce businesses often pay just $0.90 to $2.50. Knowing your CPC helps you manage your budget wisely and understand how competitive your market is.
3. Conversion Rate (CVR)
A conversion happens when someone clicks your ad and then takes the action you wanted — like buying a product, filling out a form, or calling your business. Your conversion rate tells you what percentage of clicks are turning into those actions. In 2026, Search Ads should aim for a conversion rate of 4% to 6%, Shopping Ads around 1.8% to 2.5%, and Display Ads around 0.7% to 1.2%. Top eCommerce performers hit 8% to 12% on Search. If your conversion rate is low, the problem is often your landing page — not the ad itself.
4. Cost Per Acquisition (CPA)
CPA tells you how much you spent to get one customer or one valuable action. Search Ads in 2026 average a CPA of $35 to $85, Shopping Ads average $25 to $60, and Display Ads average $45 to $120. A good CPA is one where the customer is worth more to your business than you spent to get them. Always tie your CPA goal to your actual customer value — not just an industry average.
5. Return on Ad Spend (ROAS)
ROAS tells you how much revenue you made for every dollar you spent on ads. The average ROAS across all Google Ads campaigns in 2026 is about 3.52x to 4.2x. If your ROAS is below 2x, your campaigns are likely not profitable after all costs are factored in. ROAS is one of the most important KPIs for any business that sells products or services online.
6. Quality Score
Quality Score is Google’s rating of your ads on a scale of 1 to 10. It is based on three things: how often people click your ad (CTR), how relevant your ad is to the keyword, and how good your landing page is. Here is why this number matters so much: accounts with Quality Scores of 8 to 10 pay 30% to 50% less per click than accounts with scores of 4 to 6. That means a better Quality Score saves you real money on every single click. Aim for a 7 or higher to put yourself ahead of most advertisers.
7. Impression Share (IS)
Impression Share tells you what percentage of the time your ad actually showed up when it was eligible to appear. If your Impression Share is 60%, that means you missed 40% of the chances to show your ad. There are two main reasons you might be missing impressions: your budget is too low, or your bids and Quality Score are not competitive enough. Knowing why you are losing impressions tells you exactly what to fix. Healthy accounts aim for at least 60% Impression Share on their most important keywords.
8. Impressions
Impressions simply count how many times your ad was shown to someone. On its own, this number does not tell you much — but it is the starting point for everything else. If your impressions are very low, fewer people are seeing your ads, which limits your ability to get clicks and conversions. Think of impressions as the top of your advertising funnel.
9. Ad Relevance and Landing Page Experience
These two factors are part of your Quality Score, but they deserve their own mention. Ad relevance measures how closely your ad matches what someone searched for. Landing page experience measures whether the page your ad links to is fast, helpful, and relevant. Both of these directly affect how much you pay and how often your ad shows up. In 2026, Google updated its landing page quality standards — pages that load in under 2 seconds now convert 35% better than slower ones.
10. Conversion Time Lag
This is a KPI that most small business owners never look at — but it is incredibly useful. Conversion time lag tells you how long it takes for someone to convert after they first click your ad. Some people buy within minutes. Others research for days or weeks before deciding. Knowing your average time lag helps you set realistic expectations and avoid cutting off campaigns too early before conversions have had a chance to happen.
The New KPIs That Matter Most in 2026
Google Ads has evolved — and so has the way smart advertisers measure success. The most forward-thinking businesses in 2026 are moving beyond basic metrics and focusing on what experts call profit-based KPIs. Here are three worth knowing:
- POAS (Profit on Ad Spend): Like ROAS, but based on actual profit — not just revenue. This gives you a much more honest picture of whether your ads are making money after costs.
- ncROAS (New Customer ROAS): Measures return specifically from first-time customers. This helps businesses that rely on repeat purchases understand how efficiently they are actually growing their customer base.
- CPQL (Cost Per Qualified Lead): Instead of counting every form fill as equal, this tracks only the leads that are actually likely to become customers. Especially useful for service businesses and B2B companies.
These advanced KPIs go beyond what Google shows you by default, but they paint a much more accurate picture of your true advertising efficiency.
Major Changes to Google Ads Reporting in 2026
Keeping up with Google’s updates is one of the biggest challenges for any advertiser. Here are the most important changes affecting how you measure KPIs right now:
GA4 Attribution Model Update (April 2026)
Google updated its attribution model in April 2026 — this is how Google decides which ad gets credit when a customer interacts with multiple ads before buying. The new model gives more credit to ads that appeared earlier in the customer’s journey, not just the last one they clicked. This changes how your conversion numbers look in your reports, so if your numbers shifted in April, this is likely why. It also means campaigns you may have written off as “not working” might actually deserve more credit than you thought.
Performance Max — Much Better Reporting
Performance Max (PMax) campaigns — which run ads across all of Google’s platforms at once — used to be a bit of a black box. You could see results, but it was hard to tell what was actually causing them. That has changed significantly in 2026. Google now provides detailed search term reports, asset-level performance data, and even AI-recommended negative keywords inside PMax. You can now see which headlines, images, and landing pages are performing best — and make smarter creative decisions based on real data.
Asset Experiments — Test Before You Commit
Google launched new asset experiment tools for Performance Max in 2026, allowing advertisers to test different creative assets in a controlled way before rolling them out fully. Even better, you can now evaluate experiments using two different success metrics at once — so you can see how a change affects both your conversion volume and your efficiency at the same time. This is a huge step forward for businesses that want to improve their creative without guessing.
AI Max Reporting Added
With the launch of AI Max for Search campaigns, Google also added new reporting tools so you can see which search terms triggered your ads, which headlines performed best, and which landing pages drove the most results. Google recommends waiting at least two weeks after turning on AI Max before making changes — giving the system time to learn before you start optimizing.
The Biggest KPI Mistake Most Advertisers Make
Here is something really important that most people get wrong: not all numbers deserve equal attention. Many advertisers — and even some agencies — put clicks, impressions, and CTR front and center in their reports. These numbers are useful for diagnosing problems, but they are not the numbers that tell you if your business is growing.
The numbers that actually matter are the ones tied to real business outcomes: conversions, CPA, ROAS, and profit. Impressions and CTR are like checking if your car engine is running. ROAS and CPA are like checking if you actually arrived at your destination.
Another common mistake: confusing the two types of Impression Share loss. Losing impressions because of budget is a different problem than losing them because of a low Quality Score — and the fix for each is completely opposite. Always make sure you know why you are losing impressions before deciding what to change.
How to Use Google Ads KPIs to Grow Your Business
The best way to use Google Ads KPIs is to look at them together, not in isolation. Here is a simple process that works:
Start with your ROAS and CPA — these tell you whether your ads are profitable. Then look at your conversion rate — if it is low, your landing page likely needs work. Check your CTR — if it is low, your ad copy needs improvement. Look at your Quality Score — if it is below 7, focus on ad relevance and landing page speed. Finally, check your Impression Share to see if budget or bidding is limiting your reach.
Following this process regularly — even once a week — can make a dramatic difference in how your campaigns perform over time. For more in-depth resources on how KPIs connect to overall campaign strategy, WordStream’s 2026 Google Ads Benchmarks report is one of the most comprehensive and trusted data sources available, covering over 13,000 campaigns across 23 industries.
You Do Not Have to Do This Alone
Tracking and acting on Google Ads KPIs takes time, attention, and expertise. For busy small business owners, it can feel like a second full-time job — especially as Google keeps adding new features and changing how things work. That is exactly why so many businesses turn to professionals who specialize in search engine marketing for small business.
At Sheaf Media Group, we monitor all the right KPIs for our clients every week — adjusting bids, improving Quality Scores, optimizing landing pages, and making sure every dollar of your ad budget is working as hard as possible. Our PPC Management For Small Business services are built to deliver real, measurable results — the kind you can see in your revenue, not just your dashboard.
The right Google Ads KPIs are your roadmap to smarter spending and faster growth. Start paying attention to the numbers that actually matter, and you will be amazed at how much clearer your path forward becomes.

Juan is a Digital Advertising / SEM Specialist with over 10 years of experience with Google AdWords, Bing Ad Center, Facebook, LinkedIn, Google Analytics, HTML, and WordPress. He is a co-founder of Sheaf Media Group and has work in several online advertising projects for retail, automotive, and service industries. Additionally, Juan holds a bachelor’s degree in Psychology and has a deep interest in the science of human behavior which he attributes as the key factor for his success in the advertising world.